Enhance Your Development Toolkit: Adding Xcode Instruments to Your Skill Set — I
There are plenty of factors that impacts quality of an app. Performance is one of the essential ones. Xcode Instruments helps you analyze performance of your app in various aspects such as CPU usage, app launch time, leaks, freezes, and many others. This article aims to simplify initial complexity of using the tool and streamline the process of integrating Instruments into your development workflow.
You can profile your app’s performance across different contexts, including measuring app launch time, monitoring how your app spending time at specific intervals, checking for abandoned allocations, identifying memory leaks in all Apple environments. Instruments is not only a tool to address when you notice a problem, but it’s also a tool that helps you identify potential issues you may not have been aware of and optimize your code.
Initially, your selected scheme’s build configuration should be set to Release and the run destination should be a real device. These are two important steps for the most efficient results. You can also switch to these settings after opening instruments.
- Release mode: simply, you should analyze what you submit to the App Store. The level of optimization is different with debug and release modes.
- A real device: simulators use your Macbook’s system resources that are not available on any iPhones or iPads. Therefore, you should use a real device, an iPhone, iPad, or a watch to analyze the project under real system resources.
You can open Instruments via Product -> Profilein the menu bar or CMD+I.Your app will be built and Instruments will be launched.
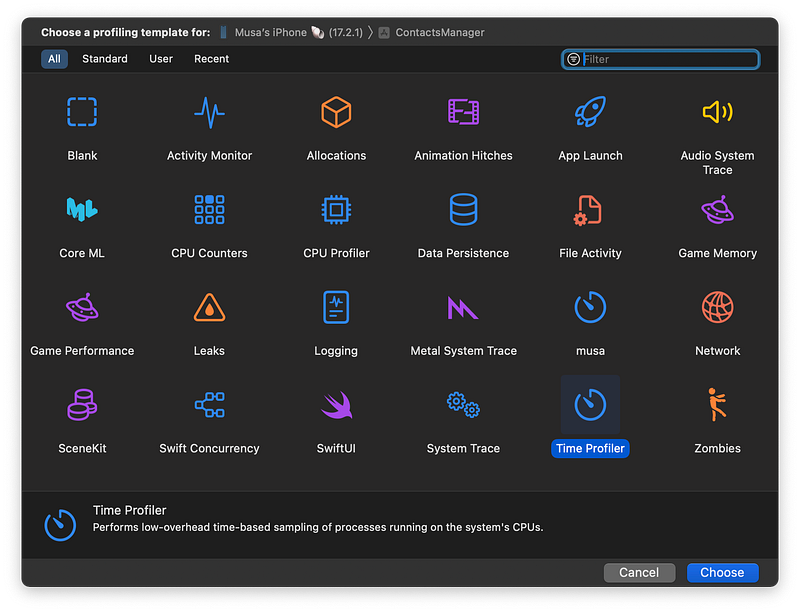
At the first glance, this page may seem confusing, with many things that you may not fully understand. However, there are only two key concepts that you need to know; instruments which show analyzes in different contexts and templates which groups the Instruments together.
In the first screen, you can see templates. When you open one of them, you will see a group of instruments. Let’s open Time Profiler. By default, you’ll have Time Profiler, Points of Interest, Thermal State, and Hangs instruments. This template may vary in each Xcode version but it is not important. You can add or remove instruments to each template or even create your own template. When you find the instruments that you want to measure frequently, you can save them.
I won’t be using the Thermal State instrument, so I’ll select it and press delete to remove it. In addition to these instruments, I also want to instrument Allocations. I will click on the “+” button in the upper right corner of the window. Here, you can see all the instrument options along with a short description. Let’s select Allocations.
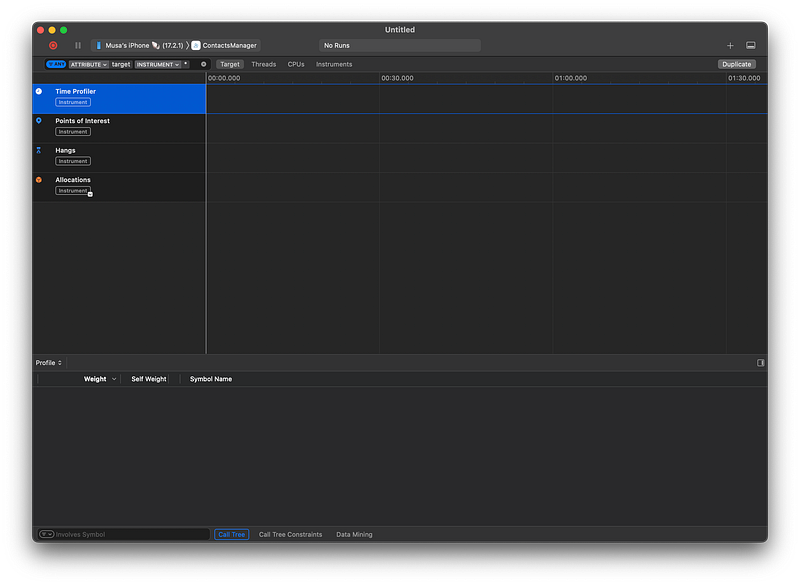
Now, let’s take a look at this page. On the left side of the toolbar, there a is record button. This button launches your app and starts recording while you run features and navigate pages in the app. Next to the Record button, you will see the selected device and scheme. By clicking on them you can select others, including your extensions for the scheme. On the right, you see the + button to add other instruments and a button to show/hide Details area.
Below this, you will see list of instruments and a timeline/graph for each. Here’s what each instrument in the list does;
- Time Profiler shows memory usage on a specific thread over time.
- Points of interest shows data between the lines where you used Signpost API. For instance, you want to measure how long a method takes to complete.
- Hangs shows if your app has noticeable delay / UI freezes.
- Allocations shows memory allocations in the app.
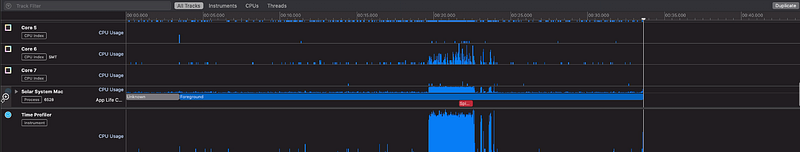
Track Viewer/Graph displays the data on the timeline. You can see significant changes here and select (or hover) intervals to filter data if there are peaks. If you see “spinning” red tag, it means that your main thread/UI is blocked. You can also sort by memory usage independent of other keys or filter by a specific name.
Details View & Extended Detail sections show the track of operations recorded when you start recording. Then, when you select one of them, you will see more detailed track in Extended Details View. This section might be closed initially, you can click the expand button on the right side of this section and open it.
What is the same for every instrument is this; you should analyze the tracks in the detail view. To find more details, you should have a look at the expanded view. Once you detect the source of the issue, you need to open it in Xcode, fix the problem, and repeat this process until the graph turns to the normal
Let’s Start with recording
In the toolbar, there is a record button. To gather some data, click this button and your app will begin running. Navigate through pages and perform some actions. You will see that the data will be displayed in the details view. Perform some repeatable actions again. Then, you can stop recording.
If the record button is unavailable, your device’s connection may be lost. You should restart the Instruments.
Instrument tools will be consuming some resources, if your app is already using huge memory, you can record it in windowed mode. You will enable this by pressing File -> Recording Options or ⌥⌘R. Then, change recording mode to last …. seconds, enter a duration and click Record. In this case, you will see the data after you stop recording.
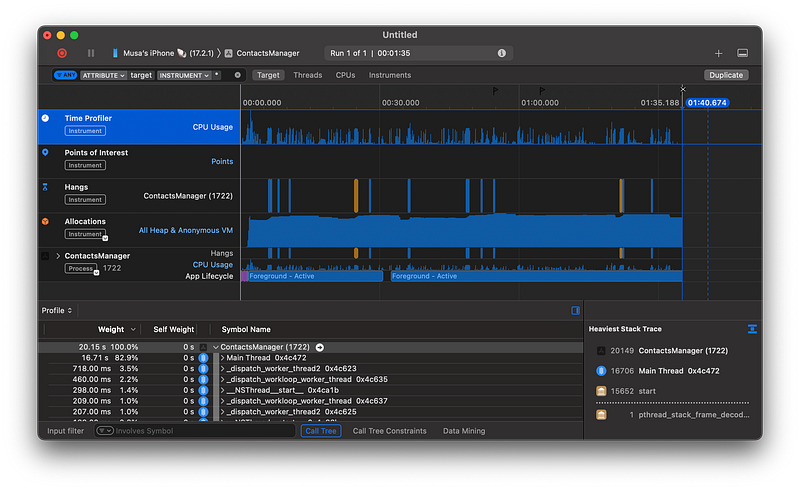
Let’s start by examining the Time Profiler graph. You can zoom in the graph if you’ve recorded for a long time. Time Profiler shows CPU utilization. When you hover the graph with the mouse, you will the percentage of CPU usage.
Let’s check the area that shows high percentage of CPU usage (if present) and pin Time Profiler to the bottom. We can do this by clicking + button the instrument label. Then, scroll down in the instruments list and find your app’s name. Expand it to see more details.
The graph shows you the life cycle and some data like “spinning”, if you have that it means your main thread is blocked at that time.
Let’s assume your app using high CPU at some point or has a spinning tag. When you select this part in the graph, the call graph will be filtered in the details view. In the details view, focus on the self weight and symbol name sections, and unfold the tracks with high CPU usage and a person icon next to them. You can also open the source code by double clicking.
The project itself will weight %100 and that is normal. Because it is running all the time and you do not have control over that.
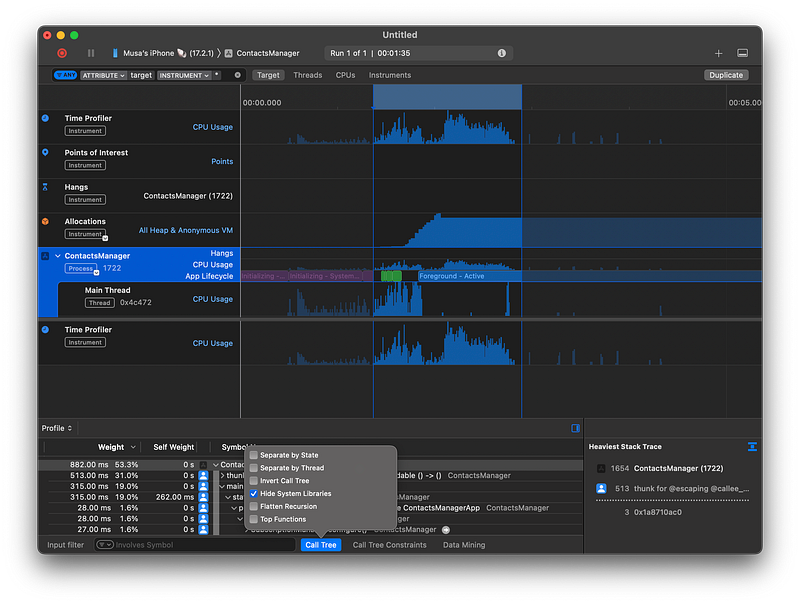
It is easier to debug if you hide system functions. In the bottom toolbar, there is a button called Call Tree. You will find several options to customize the details view. I use Hide System Libraries very often.
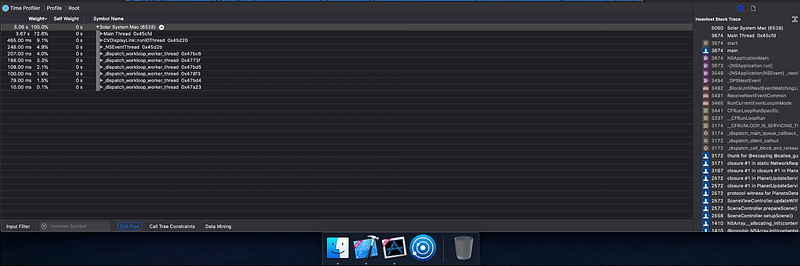
Next, when you look at the next call, it should also have high percentage if there is a problem. Expand it to see the details until finding a meaningful method that you may have written. Click option and expand (triangle) button to expand all at once.
Also, when you click on a call in the extended view, you will find the heaviest stack trace, which shows m the ost frequently called methods during the snapshot. Start looking from the top ignoring “thunk” and find a meaningful one that relates to your code. Click on it, and it will select the related call in Details View. Click on the arrow on the right, or double click the call to the code.
In the toolbar of Details view, at the top right, you will see Xcode button, you can click on it and open the code in Xcode. Fix that, rerun the instruments, and record again to ensure the problem is solved. To say it again, this is how you should debug the app by using any Instrument options. *If you have any issues with opening the source code, or the code in Xcode, have a look at this discussion.
Conclusion
In the first article of this series, I introduced the Instruments tool and utilized the Time Profiler tool. After selecting the template containing the necessary tools, it’s crucial to run the application in Release mode and on a real device. Analyze the graph to identify suspicious parts of your code, address them, and repeat the process until those problematic segments disappear.
Time Profiler shows the CPU utilization. If there is a high CPU usage in some interval, it means that you should fix something in your project. You should examine Time Profiler graph, find out related track in details view and fix that in Xcode until the graph returns to normal. The next articles will cover usage of other instruments.
I hope this article helps visitors of this page. If you have any comments or questions, please don’t hesitate to contact me.
Twitter Linkedin
Sources